To improve your experience in gathering and reviewing key data for all of your accounts, Conversica provides Reporting to Conversica’s group dashboard.
Now you can aggregate and visualize data for all of your accounts in one place using the same dynamic beta reports that are available in a single dashboard. Utilizing Reporting in the group dashboard eliminates the need to toggle between multiple dashboards to analyze your data.
To start viewing your reports, log into your group dashboard, and click the Reporting tab.
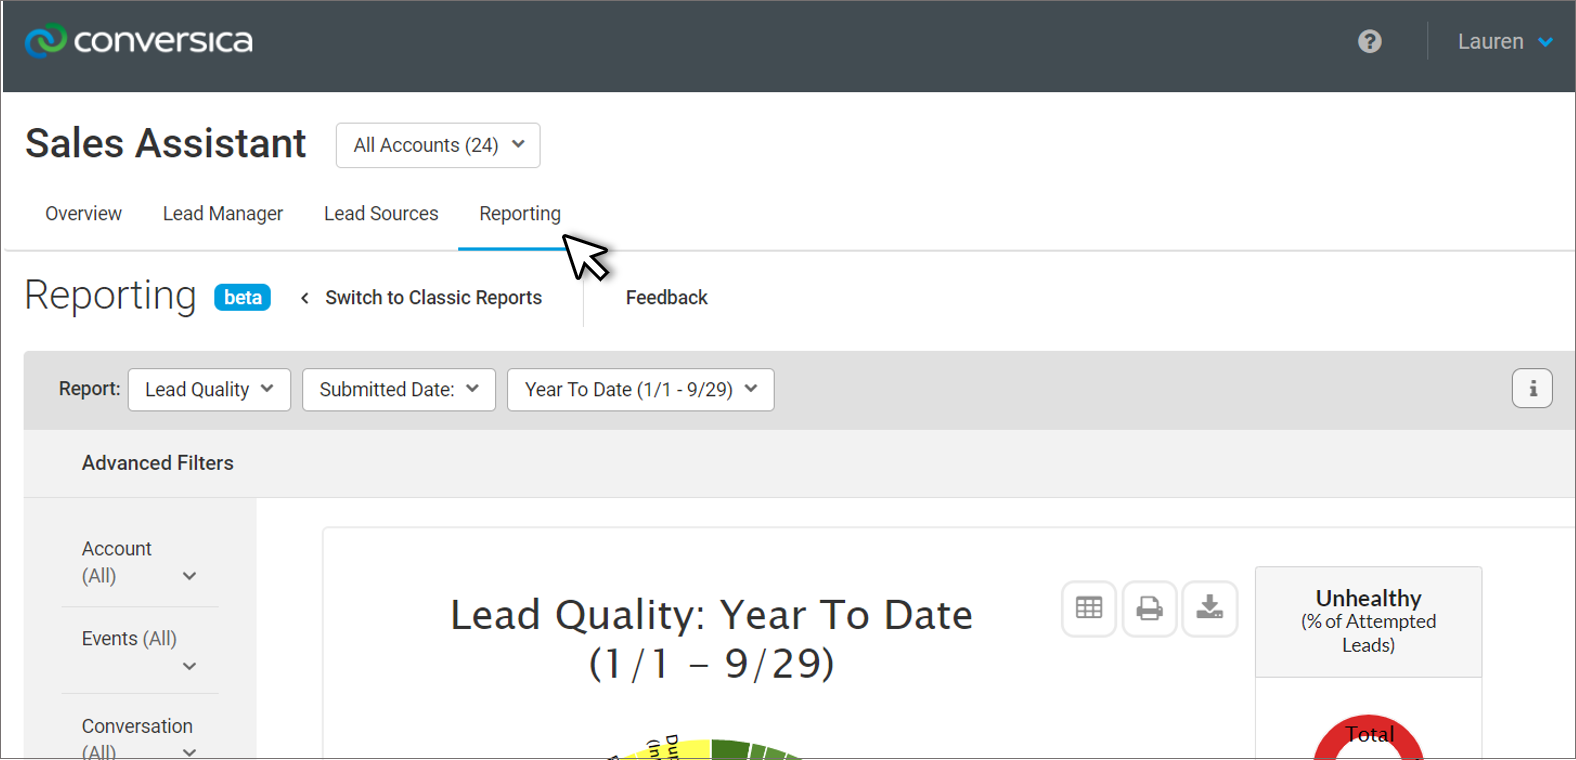
From the Reporting tab, click the Report dropdown to select which report you want to review.
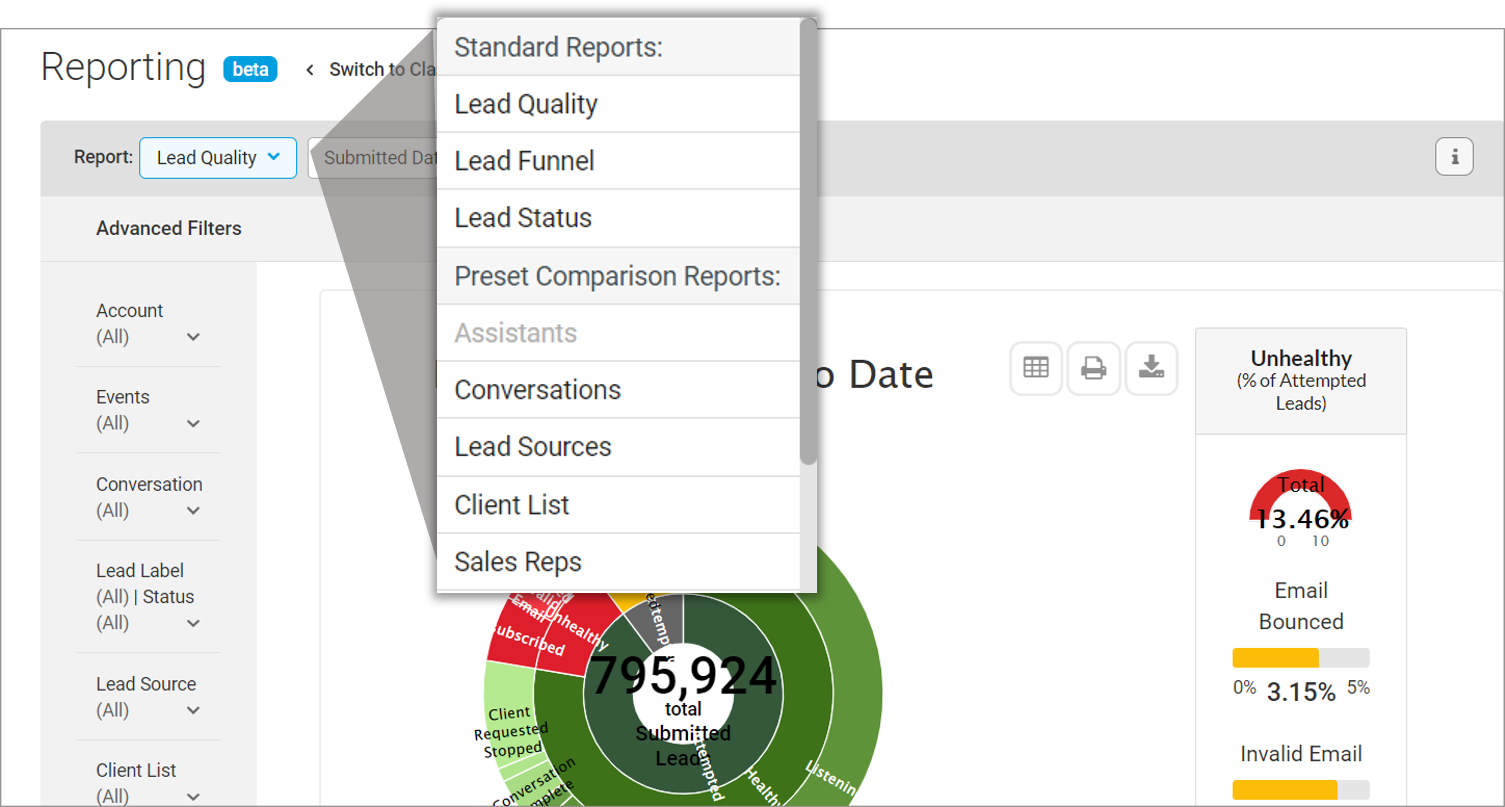
By default, all of the accounts in your group dashboard will be included in the metrics. To focus on specific accounts, lead statuses, conversations, and more you can drill down with Advanced Filters.

Available Reports
The Conversica group dashboard provides a list of preset reports designed to answer common business questions that can be customized with advanced options to create unique reports.
Standard Reports:
- The Lead Quality Report (link to reporting article when finazlied) will help you to understand the overall health and deliverability of the leads that you submit to Conversica.
- The Lead Funnel Report (link to reporting article when finalized) helps you review how your leads are progressing through Conversica’s system.
- The Lead Status Report (link to reporting article when finalized) displays the current lead status of all leads in the specified date range.
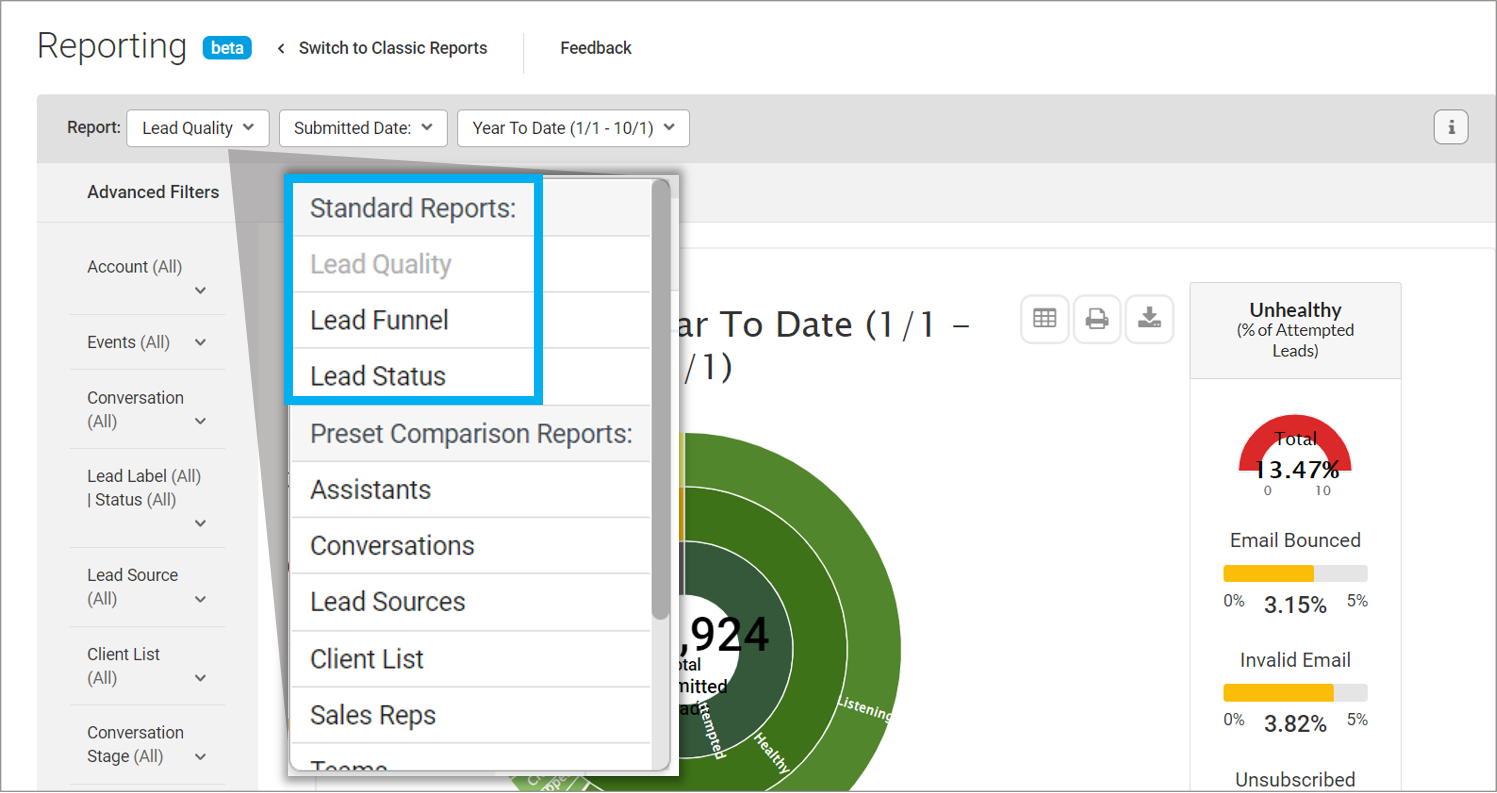
For more information on the available reports and features, review our Reporting Enhancements - Open Beta Help Center article.
Pre-Set Comparison Reports:
Use these reports to directly compare how your accounts are performing.
The available comparison reports types are:
- Assistants: Compare the Revenue Digital Assistant’s™ lead performance. For example, view the submitted leads, how many were accepted, engaged, and became hot.
- Conversations: Compare conversation performance across all of the Assistants. For example, review which Conversation had the most submitted and worked lead and how many leads in each conversation resulted in a Satisfied Lead.
- Lead Sources: Compare which lead sources provide the healthiest (or unhealthiest) leads. For example, track which lead sources consistently performs well (more engaged, Hot, and Satisfied Leads).
- Client List: Compare the performance of each client list worked by one of the Assistants. For example, review messages sent and received for each list and see how many phone numbers were received.
- Sales reps: Compare the performance of all of the reps working leads across multiple accounts at once.
- Teams: Compare the performance of all teams working leads across multiple accounts at once.
- Trends: Compare key metrics from all of the accounts over weeks, months, or quarters in a year.

Custom Report Settings
The new Custom Comparison reports work similarly to the classic custom reports. With these reports you are able to create a custom report using the following settings:

- View: Choose a primary metric to report on. This can be either the number of leads in a certain category (such as leads who opened a tracking image), or the percentage between leads in two categories (such as leads who opened a tracking image as a percent of leads who were sent a tracking image).
- Breakdown: You can breakdown the primary metric to compare it across a certain category. For example, by breaking down a report by Conversations you can compare your selected metric broken out by each conversation.
- Compare With Metrics: You can choose one or more additional metrics to compare against your primary metric.
- Compare By Dimension: You can further compare your selected metric across a second dimension. For example with a report that is broken down by Conversation and compared by Lead Status, you can compare metrics broken out by each conversation, and within each conversation, you can further compare the metrics broken out by each lead status.
Note: The ability to group or breakdown comparison reports by account is currently not available but will be in a future release!
Filters
There are three main filters available on the Reporting tab:
- Report Type: Which report you want to review.
- Date Range Type: Specify which types of dates will be used (for example, the dates when contacts are submitted to Conversica, the dates when they are scheduled to be sent their first message, and more).
- Date Range: Select the time period you want to review or enter a custom date range.
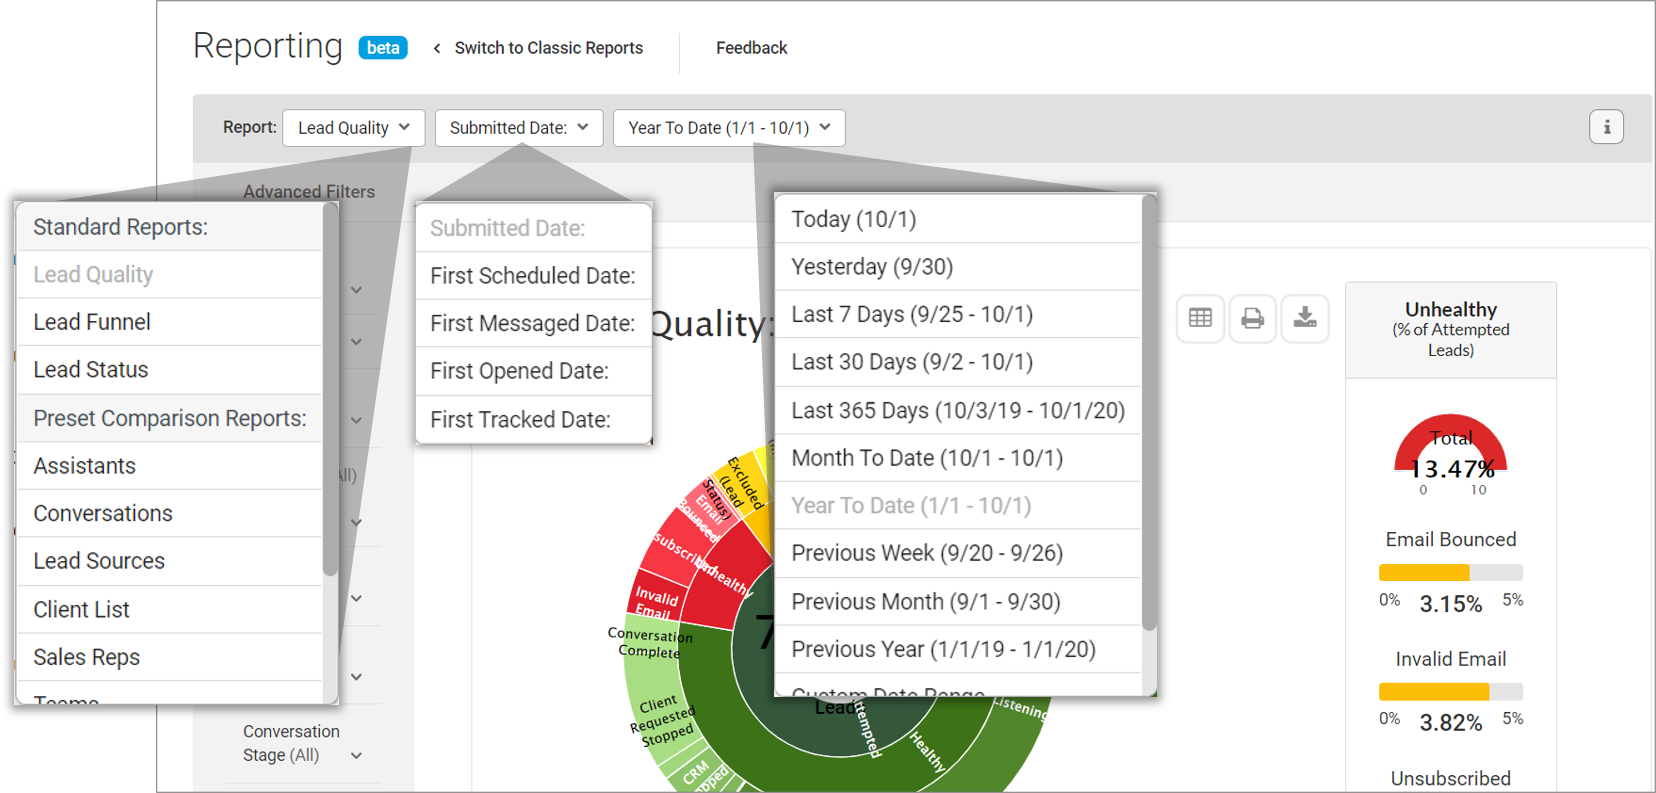
To customize what data is displayed, use a combination of the filters to review your desired metrics.
Advanced Filters
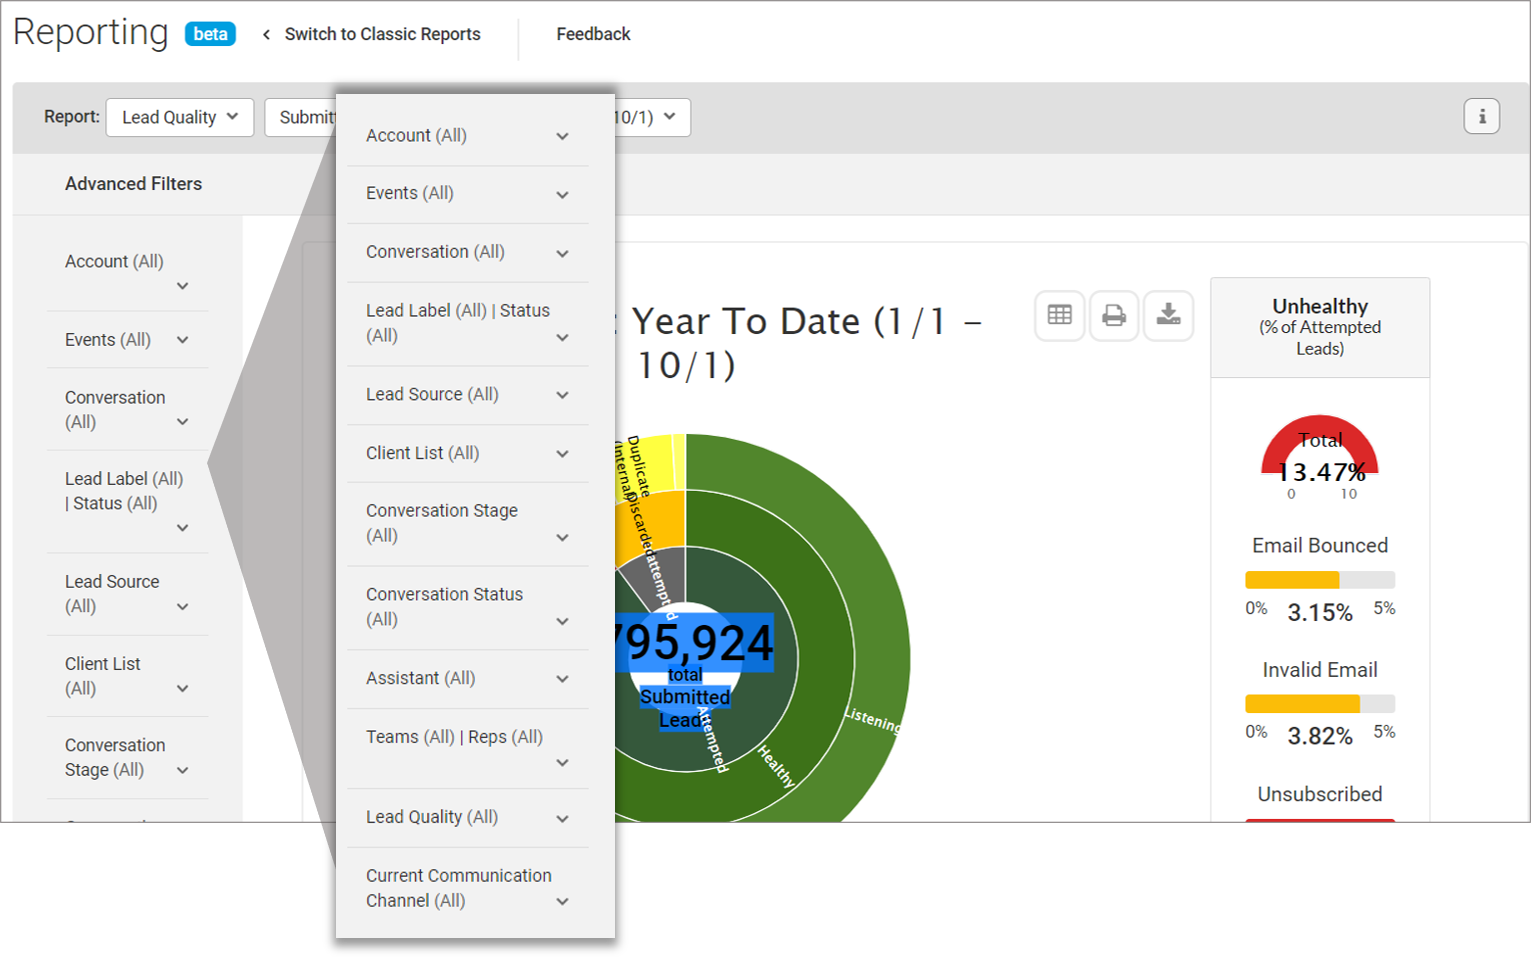
To further analyze your reports, you can use Advanced Filters to identify specific segments and data (i.e. only contacts using a specific conversation, certain status, or assigned to a specific user).
The available Advanced Filters are:
- Account
- Events (for more detailed information and definitions of Events, review our Event Data Reporting and Analytics Help Center article)
- Conversation
- Lead Label | Status
- Lead Source
- Client List
- Conversation Stage
- Assistant
- Teams | Reps
- Lead Quality
- Current Communication Channel

Comments
0 comments
Article is closed for comments.