
Conversica Answers is a great way to lower the number of Leads to Review. It can also help focus your team’s time by allowing them to concentrate on the booked meetings and not have to worry about leads that ask some of your most common questions. However, once you turn this feature on, how do you track its usage?
With this custom report recipe, you can set up a query in your profile that will allow you to quickly see how many leads received a “Conversica Answers” response. You can then download that data and share it with your team or your stakeholders to highlight the behind-the-scenes work that your assistant does for your company, everyday.
What You’ll Need
- Access to Conversica reports.
- Admins, managers, or users with manager permissions, have access to reporting in the Conversica Dashboard.
- Familiarity with creating custom reports. For more information on this process, please read Creating Custom Reports in our Help Center.
How to Create the Report
- From the Conversica dashboard, select Reporting > Create New Custom Report.
- Ensure the Date Range Type is set to Submitted Date.
- Set the Date Range to whatever time frame you are wanting to analyze (Last 7 Days, Last 30 Days, All-Time, etc.)
-
- Or select a Custom Date Range.
- Click the Date Range picklist.
- Select Custom Date Range.
- Enter the desired Start Date.
- Enter the desired End Date.
- Or select a Custom Date Range.
-
- Click Metrics and from the drop-down select Leads Messaged with Conversica Answers and Leads Messsaged with Conversica Answers (% of Messaged Leads) > Apply.
Optional: If you want to see how many leads were messaged with Conversica Answers by Conversation or Contact List, you may choose to further customize your report by enabling the Breakdown By: option. However, you can also run this report with Breakdown By: None which is the default.
How to Review the Report
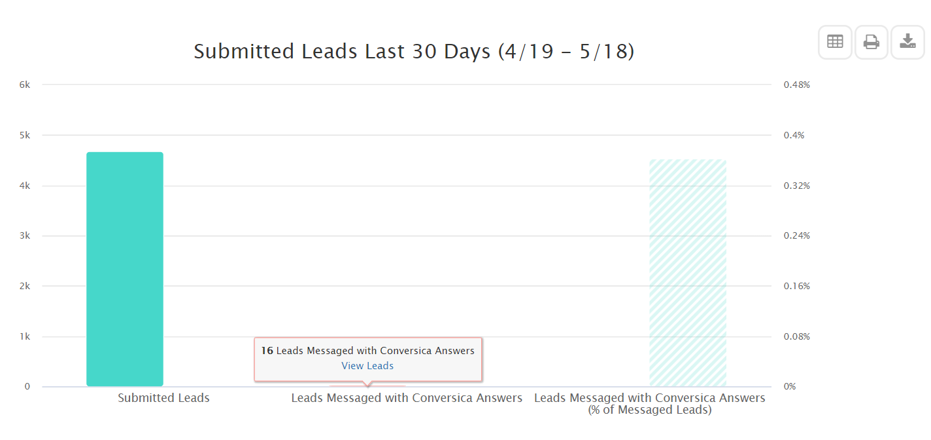
Once you’ve applied your custom settings, you should see a bar chart with your total number of Submitted Leads during the specific time frame, how many of those received a Conversica Answers response, and that number represented as a % of the total messaged leads.
You will then have the option to download the chart, export the data to a .csv spreadsheet, or “view” the applicable leads in the given category within the Lead Manager.
Once you have the report set with the desired filters, we encourage you to save this as a New Custom Report, so you can revisit it at any time. Additionally, should you wish to make changes to this custom report and create a new saved report, this is also possible. If you need more support on our Custom Reporting tool, please see our Help Center article on Saving and Sharing Custom Reports.
Suggested Frequency to Run this Report
- Within the first 30 days of activating a new “answer”.
- Any time you are curious about how Conversica Answers is working for you and want to see how many leads your assistant has messaged with your custom answers.
Additional Resources
To learn more about the available reports and how to use them to your benefit, check out this related article:
- For an overview of the available reports, check out our Reporting article.
Comments
0 comments
Article is closed for comments.