Conversica’s Executive Reports provide a quick and easy way for you to view the performance of your company’s Revenue Digital Assistant™ (RDA). Presented in a streamlined PDF, your company’s most recent performance data is all on one page without the need for additional filters or work on your end.
By presenting your company’s most recent data in a streamlined PDF, you can make quick, data-driven decisions that drive productivity and grow revenue. This article will help you better understand how each report and metric is calculated.
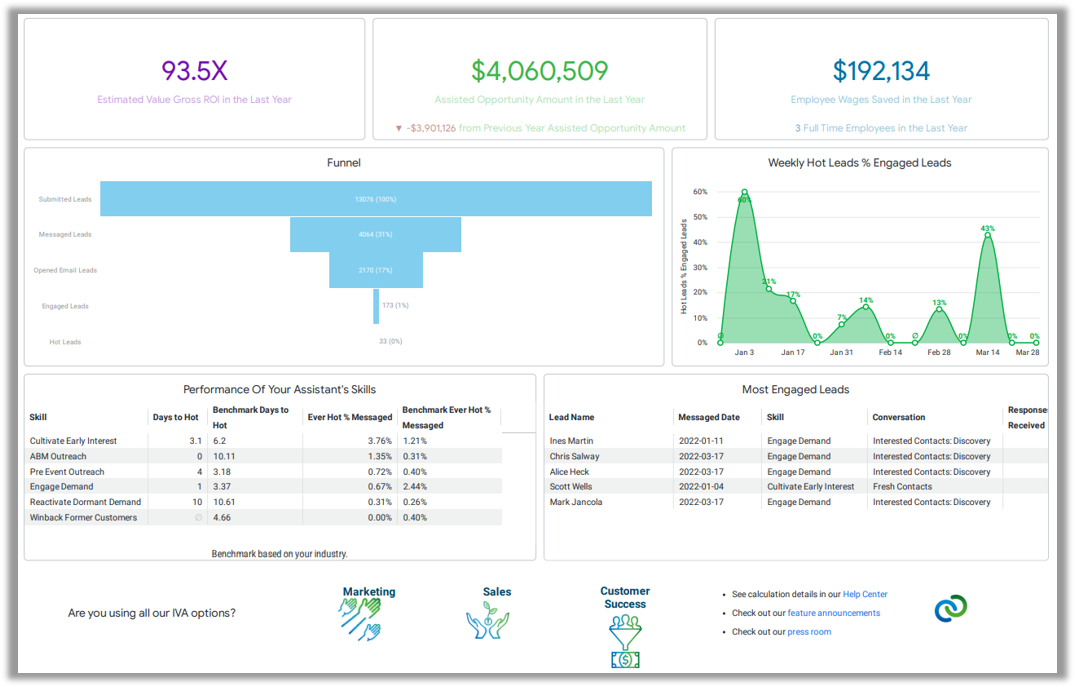
Note: The following reports are curated by the Conversica team outside of the reporting provided in our Dashboard. If you have any questions about these reports, please connect with your Customer Success Manager.
Estimated Value Gross ROI in the Last Year
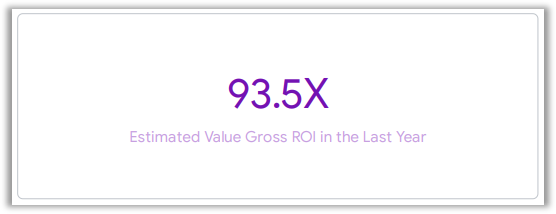
This report displays the Total Value Return on Investment for the past 365 days.
Note: The Date filter will not update this tile.
Calculations:
(Uses Hourly Wage Saved + Opportunity Revenue)
Opportunity Revenue is calculated by multiplying your Ever Hot Leads by the User Input Average Selling Price by an estimated conversion rate depending on the IVA used.
For Salesforce Integration Users: Hourly Wage Saved is calculated using your state-specific hourly wage multiplied by the hours saved which is calculated as 5 minutes per message received and 3 minutes per message sent.
Conversion Rates:
- Customer Success IVA is 0.75 (75%)
- Sales IVA is 0.5 (50%)
- Marketing IVA is 0.25 (25%)
Assisted Opportunity Amount in the Last Complete Year 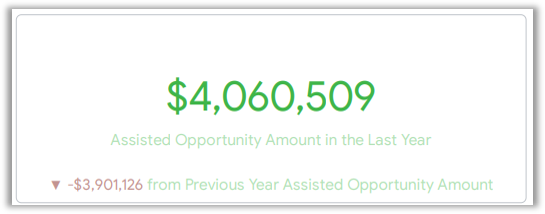
Displays the assisted opportunity amount in the last 365 days. This tile is not impacted by the date filter, and will always show the Assisted opportunity amount in the past 365 days, and compare it to the previous 365 days.
Criteria for counting an assisted Opportunity:
For Salesforce integration users: A Salesforce contact has a contact role with a specific opportunity or if a lead was worked by Conversica, then the lead must have been converted to contact that has a contact role with a specific opportunity.
Assisted Opportunities do not need to be closed/won to be counted in our calculation. A single contact may have more than one Opportunity and we count each opportunity in this metric.
For Non-Salesforce integration users: The assisted opportunity amount is calculated by multiplying your Ever Hot Leads by the User Input Average Selling Price by an estimated conversion rate depending on the IVA used.
Conversion Rates:
- Customer Success IVA is 0.75 (75%)
- Sales IVA is 0.5 (50%)
- Marketing IVA is 0.25 (25%)
Employee Wages Saved in the Last Year
Displays the total hourly wage saved by the IVA’s work for the past 365 days.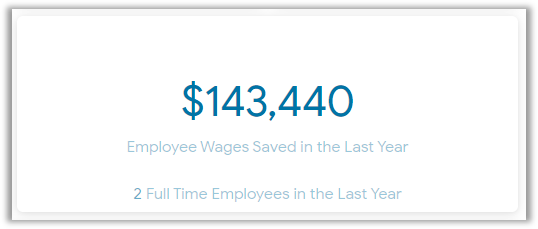
Calculations:
Wages Saved is calculated using your state-specific hourly wage multiplied by the hours saved which is calculated as 5 minutes per message received and 3 minutes per message sent.
State wages represent the 25th percentile in each state collected from the US Bureau of Labor Statistics.
Full-time employees is calculated as the hours saved / 2080 which is the number of hours a full-time employee works in a year.
Funnel
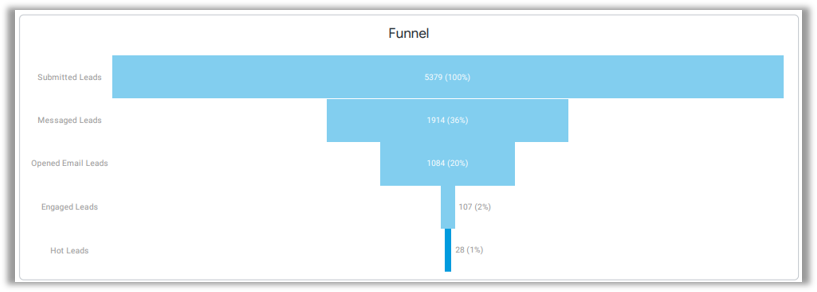
The Funnel report displays the progression of leads through their Conversica journey to become Hot Leads. A Hot Lead is a lead who engages with the Revenue Digital Assistant and is highly interested in your product/service. A quick glance at this report will help you understand how many leads are going from freshly submitted leads to Hot Leads and the other stages in between.
For example, if you identify a large number of leads are opening your emails but not engaging or turning Hot, then it is best to review your current conversations and their intent to ensure your RDA is set up for success.
The different lead stages displayed are:
- Submitted Leads: The number of new leads submitted to Conversica.
- Messaged Leads: The number of leads that Conversica was able to message. This does not include leads that Conversica attempted to work but was unable to message because the lead’s email address was filtered out by Conversica’s email verification system. This system filters out email addresses that are likely to be spam traps or otherwise risky to send to, in order to protect your deliverability and sending reputation.
- Opened Email Leads: The number of leads who viewed the tracking image sent in the Revenue Digital Assistant's email signature. When this image is viewed, it indicates that the leads opened the email message. This metric is on the lead level, meaning we only log an email as "opened" the first time the lead opened the email. We do not count the total number of emails a single lead opens in during their conversation with the RDA.
- Engaged Leads: A lead that has sent a response to your RDA’s outreach.
- Hot Leads: A lead that engaged in conversation with your Revenue Digital Assistant and has responded, indicating interest in your product/services.
Weekly Hot Leads % Engaged Leads
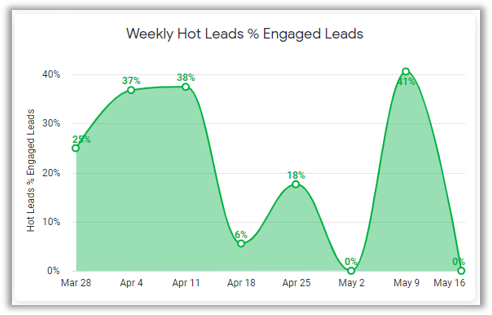
This report displays the weekly count of Engaged Leads that turned Hot during the date range selected.
At a glance, you can review the data for any drastic changes. Any severe drops may be an indicator of unhealthy leads entering the system and not engaging the RDA or turning Hot. Any spikes or influxes can correlate with additional leads entering the system or should be expected after deploying a highly customized outreach.
To further investigate which lead sources or conversations may be contributing to the drop in Hot Lead %, contact your Customer Success Manager.
Performance Of Your Revenue Digital Assistant's Skills
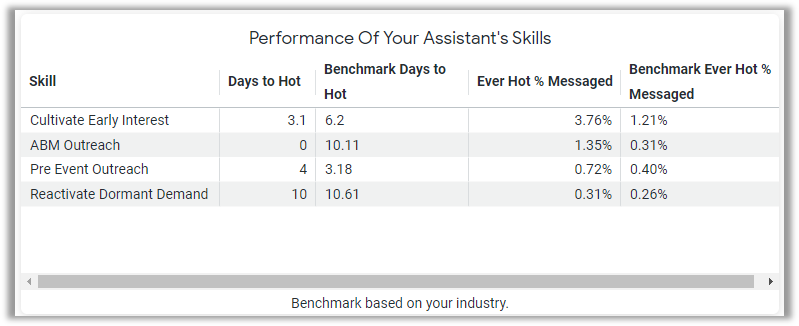
This table shows you how your Revenue Digital Assistant’s performance stacks up against industry benchmarks for the same skills. If you notice your metrics are consistently below industry benchmarks, reach out to your Customer Success Manager to discuss potential solutions to optimize your RDA's performance.
Calculations:
- The skill benchmark is calculated using metrics from all non-test accounts in the past 15 months (for your industry) for conversations that messaged over 15 leads.
Most Engaged Leads

Displays the leads that have sent the most responses to your RDA during a conversation. With this data, you can review which skills or conversations have leads that engage the RDA more than others. If continuously, the same skill/conversation has the most responses, it may be beneficial to replicate certain aspects to other skills/conversations.
Table includes:
- Lead Name: The lead’s full name.
- Messaged Date: The date the lead received their first message from Conversica.
- Skill: the Revenue Digital Assistant skill used to engage the lead.
- Conversation: the conversation used to engage the lead.
- Responses Received: the total number of responses the lead has sent the Revenue Digital Assistant.

Comments
0 comments
Article is closed for comments.