
As part of our integration with Salesforce, we are able to track opportunities where the Revenue Digital Assistant™ “assisted” in creating pipeline. For more information about this functionality and how it works within the integration, you can read Reporting on Salesforce opportunities.
This recipe will show you how you can use the opportunity data to create a custom report in your Conversica dashboard so you can pull this information quickly and easily.
What You’ll Need
- To view the data in this report you must utilize our Salesforce integration.
- Access to Conversica Reporting.
- Admins, managers, or users with manager permissions, have access to reporting in the Conversica Dashboard.
- Familiarity with creating custom reports. For more information on this process, please read Creating Custom Reports in our Help Center.
How to Create the Report
- From the Conversica dashboard, select Reporting> Create New Custom Report.
- There are two options for your Event Data:
- If you want to see all the leads that became an opportunity in your set time frame, you would select the date cohort Ever became an Opportunity in Range.
- If you only want to see how many of the leads you submitted in your time frame have become an opportunity, then you could keep the default option of Submitted Date.
- Set the Date Range to the time frame you are wanting to analyze (Last 7 Days, Last 30 Days, All-Time, etc.)
- To select a Custom Date Range click the Date Range picklist.
- Select Custom Date Range.
- Enter the desired Start Date.
- Enter the desired End Date.
- Click Apply.
- To select a Custom Date Range click the Date Range picklist.
- In the Custom Report Settings header, make sure that you are viewing Submitted Leads and you’ve added the metrics of:
- Assisted Opportunities.
- Assisted Opportunities (% of Engaged Leads).
- Assisted Opportunities Amount.
- Optional: If you wanted to see how many opportunities were created by a certain criteria, you may choose to further customize your report by enabling the Breakdown By: option. Then you would be able to see if the majority of your assisted opportunities are linked to a particular conversation, campaign, or lead source, for example. However, you can also run this report with Breakdown By: None which is the default.
How to Review the Report
Once you’ve applied your custom settings, you should see a bar chart including:
- The total number of Submitted Leads during the specific time frame.
- How many of those leads were marked as an Opportunity.
- The percentage representation of the number of Engaged leads that became an Opportunity.
- The total dollar amount associated with the Opportunity total (if we are able to see that in our API permissions).
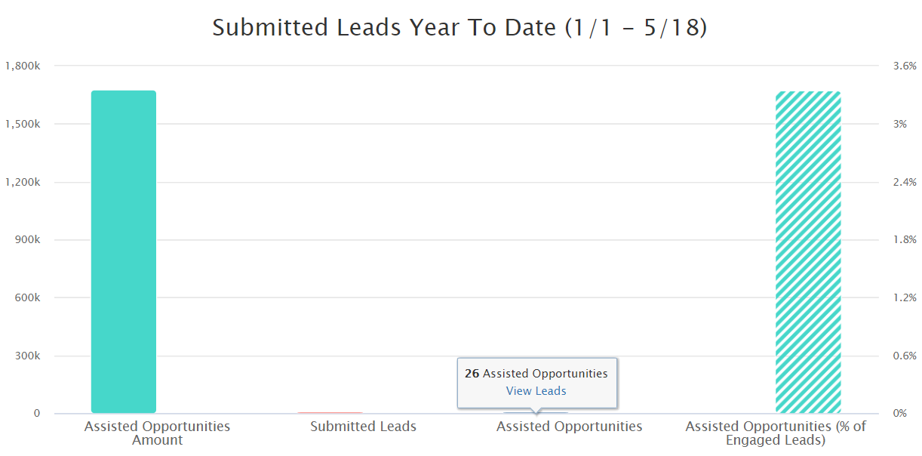
To see the total list of leads and opportunities for this given time frame, hover over any of the variables and click View Leads. This link will take you to the Lead Manager where you can download the opportunities as a .csv file. Please see Downloading Salesforce Opportunities from the Lead Manager for more information on this process.
To dig deeper into which conversations, lead sources, reps, etc. have the most opportunities, you can update the report settings to Breakdown By and select the dimension that is most important to you.
You can also use the Advanced Filters on the left side of the screen to filter out results based on Opportunity Stage and Opportunity Status. (For example, to exclude Closed Lost opps.)
Once you have the report set with the desired filters, we encourage you to save this as a New Custom Report, so you can revisit it at any time. Additionally, should you wish to make changes to this custom report and create a new saved report. If you need more support on our Custom Reporting tool, please see our Help Center article on Saving and Sharing Custom Reports.
Suggested Frequency to Run this Report
- This report is useful at any time, but some milestones to consider would be after activating a new skill/conversation, creating a new Salesforce campaign, making major shifts within the team structure, or before a quarterly review with your stakeholders.
Additional Resources
To learn more about the available reports and how to use them to your benefit, check out this related article onConversica Reporting.
Comments
0 comments
Article is closed for comments.